Total Country Reserves relative to Govenrment Debt
Overview
In this project, I examine the relationship between a country’s reserve holdings and its external debt using the World Bank’s International Debt Statistics. Specifically, I analyze the “Total reserves (% of total external debt)” indicator, which expresses a nation’s assets (foreign exchange and gold) as a percentage of its total external liabilities. This ratio offers a measure of external‑debt servicing capacity:
High values indicate ample reserves relative to debt, signaling strong repayment ability and a buffer against external shocks. Low values suggest limited reserves, raising the risk of higher borrowing costs, rollover difficulties, or dependence on external assistance.
By comparing this ratio across developing economies, the project aims to identify patterns of fiscal resilience and vulnerability.
I used SQL to filter data and extract key insights from the World Bank database. For more details, you can check out the complete code and dataset on my GitHub repository).
Table 1
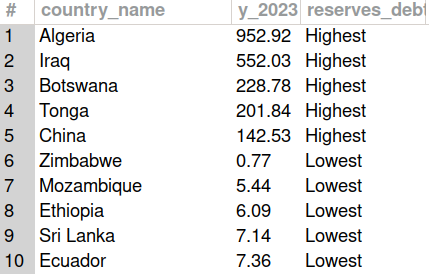
Table 1 presents the five developing countries with the highest and lowest reserves‑to‑debt ratios for 2023. Algeria (930%) and Iraq (520%) lead the list, indicating that Algeria’s reserves exceed its external debt by more than nine‑fold, and Iraq’s by over five‑fold. China also ranks among the top, with reserves covering 142.5% of its external debt—enough to fully repay its obligations and still have 42.5% left over. By contrast, Zimbabwe’s ratio is under 1%, meaning its reserves cover less than 1% of its external debt.
Having very low reserves-to-debt ratio carries significant risks. Such countries may struggle to roll over maturing obligations or defend their currency during capital outflows, which can trigger higher borrowing costs, currency crises, or the need for emergency external assistance.
Conversely, an excessively large buffer of reserves relative to debt is not necessarily a positive sign, at least not without reservations. While it does imply strong external liquidity, minimal rollover risk, and ample shock absorption capacity, it can also signal (1) under-investment, i.e., large passive reserves may reflect the lack of productive public investment in infrastructure, education, or health, for whatever reason, and (2) commodity Dependence - if reserves come primarily from volatile resource exports (e.g., diamonds in Botswana or oil in Gulf states), a price slump can rapidly erode such buffers.
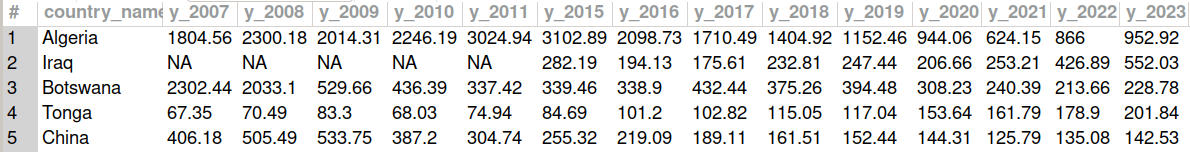
Table 2 illustrates how this played out in Botswana during the 2008–09 global financial crisis. Diamonds—accounting for 70–80% of Botswana’s export earnings—saw prices plunge by over 30%, collapsing global demand for luxury goods and triggering a dramatic drop in the reserves‑to‑debt ratio of the country in 2009. This episode underscores the risk of building reserves on a narrow, volatile base: a sudden commodity shock can rapidly deplete buffers. By contrast, China’s reserves‑to‑debt ratio has remained relatively stable throughout the years—neither excessively high nor too low—suggesting a more diversified mix of export‑driven inflows, natural resources and likely a solid reserve management. Such a profile suggests greater structural resilience against external shocks.
Table 2
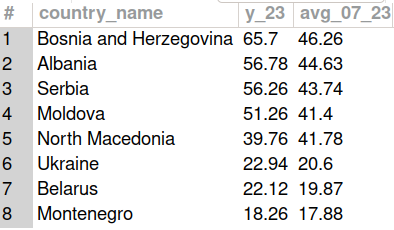
Finally, Table 3 presents the “Total reserves (% of total external debt)” for available European countries, showing both the latest available year (2003) and the 2007–2023 average. Bosnia and Herzegovina tops the list, with reserves covering a substantial share of its external debt. Moreover, the average figures show that the top five countries converge around a ratio of ~40%, indicating that on average their reserves could cover roughly 40% of external liabilities. By contrast, Ukraine, Belarus, and Montenegro average only about 20% (or less), signaling greater vulnerability in meeting external obligations.
These comparisons highlight how different economies vary in their external‑debt buffers—some maintain moderate resilience, while others remain at higher risk of liquidity shortfalls.
Table 3