FAANG Portfolio Analysis
Overview
This project examines how an equally-weighted portfolio of FAANG stocks—Meta (META), Amazon (AMZN), Apple (AAPL), Netflix (NFLX), and Google (GOOGL)—performed from January 2020 to January 2024. By leveraging daily price data from Yahoo Finance and Python libraries, I compute key performance metrics (CAGR and Sharpe ratio) before constructing the efficient frontier to find the portfolios that minimize risk and maximize risk‑adjusted return.
See the full code and dataset in my GitHub repository.
Step 1: Equal‑Weight Portfolio & Key Metrics
Starting with a simple 20% allocation to each FAANG stock, I transform daily closing prices into portfolio returns and extract two core metrics:
Compound Annual Growth Rate (CAGR): I compound every trading-day return over the four-year span, then take the four-year root to annualize. Outcome: ~20% per year, meaning the portfolio would have grown by that average rate if gains were reinvested.
Annualized Sharpe Ratio: I divide the mean daily return by its daily volatility and scale by √252 to annualize. Outcome of ~0.72 indicates the portfolio earned 0.72 units of excess return for each unit of annual risk. E.g. a 10% yearly volatility would translate into approximately 7.2% excess return.
These figures provide a baseline for optimizing portfolio weights.
Step 2: Minimum Volatility & Maximum Sharpe Portfolios
I then plot the efficient frontier (EF), which maps the highest possible expected return for any given level of annualized volatility. The EF is shown in Figure 2.
The X axis represents annualized volatility (risk). This measures how uncertain the returns are. The farther right one goes, the more risk one is taking on. The Y axis represents annualized expected return. This is the average payoff per year. The higher up one goes, the more return can be expected.
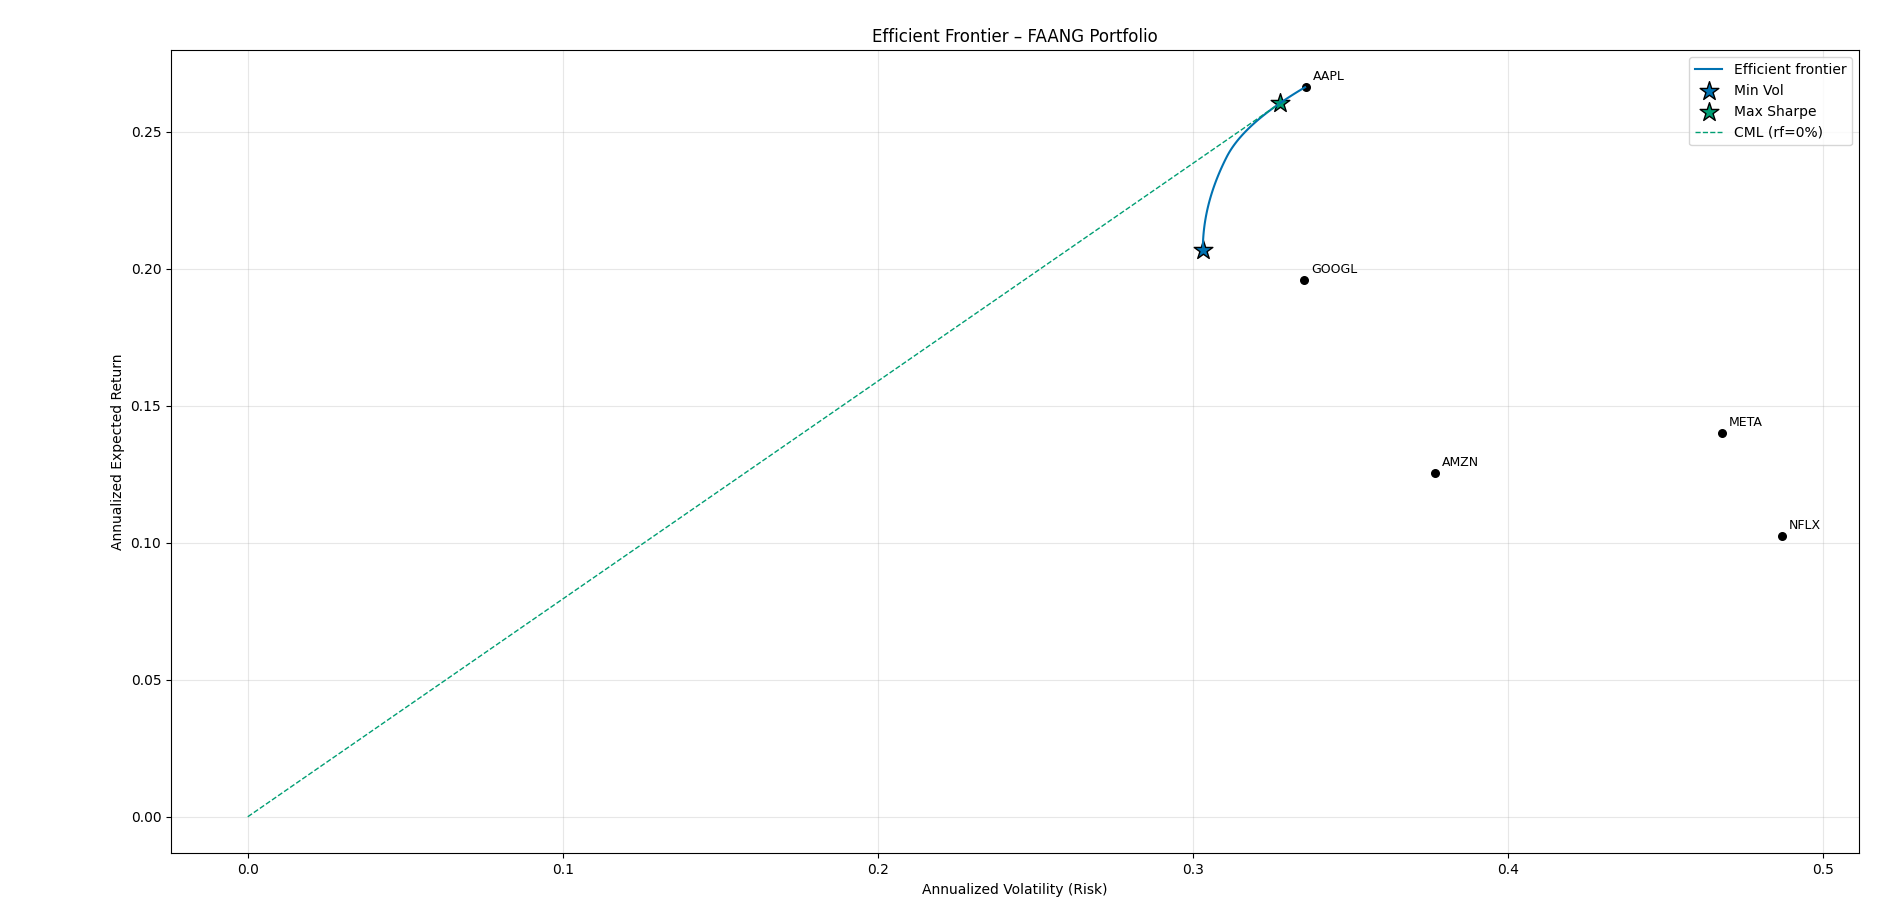
Each black dot marks a single FAANG stock’s volatility and return. The blue curve shows the frontier of efficient portfolios—those that deliver maximum return for their risk level.
Once the EF has been calculated, I can now point to two types of optimal portfolios composed of FAANG stocks.
Minimum-Volatility Portfolio
The point farthest left on the efficient frontier yields the lowest risk mix.
- Weights: AAPL 39.8%, AMZN 14.9%, GOOGL 38.3%, META 0%, NFLX 6.9%
- Volatility: ~30.3% per year, the lowest within FAANG despite being above broad-market norms (S&P 500 moves ±15-20% a year).
Volatility analysis is based on covariance matrix. So the optimizer sees META either as too volatile or too correlated (or both) with the others, so it drops it entirely. Similarly, Netflix also has relatively high volatility, so it only gets a small portion into the min-vol portfolio. Thus, for instance, the analysis suggests no allocation into META and nearly 40% of portfolio to be invested in AAPL.
Maximum-Sharpe Portfolio
The point where a line from the risk-free rate is tangent to the frontier maximizes return per unit of risk.
- Weights: AAPL 78.7%, AMZN 0%, GOOGL 19.97%, META 0%, NFLX 1.3%
- Sharpe Ratio: ~0.89, the highest risk-adjusted payoff among FAANG mixes.
This FAANG portfolio maximizes return per unit of risk (highest Sharpe). The figure 0.89 stands for excess return for every 1% of risk. Such return is modest, i.e., would yield less then one-to-one payoff which is not ideal but understandable given that it is composed of tech-heavy stocks only.
Step 3: Liberation Day Event Impact
To illustrate how FAANG stocks reacted to Trump’s “liberation day”, I plot closing prices of these stocks between April 2024 and April 2025. The vertical red line marks Trump’s introduction of tariffs (Figure 3).
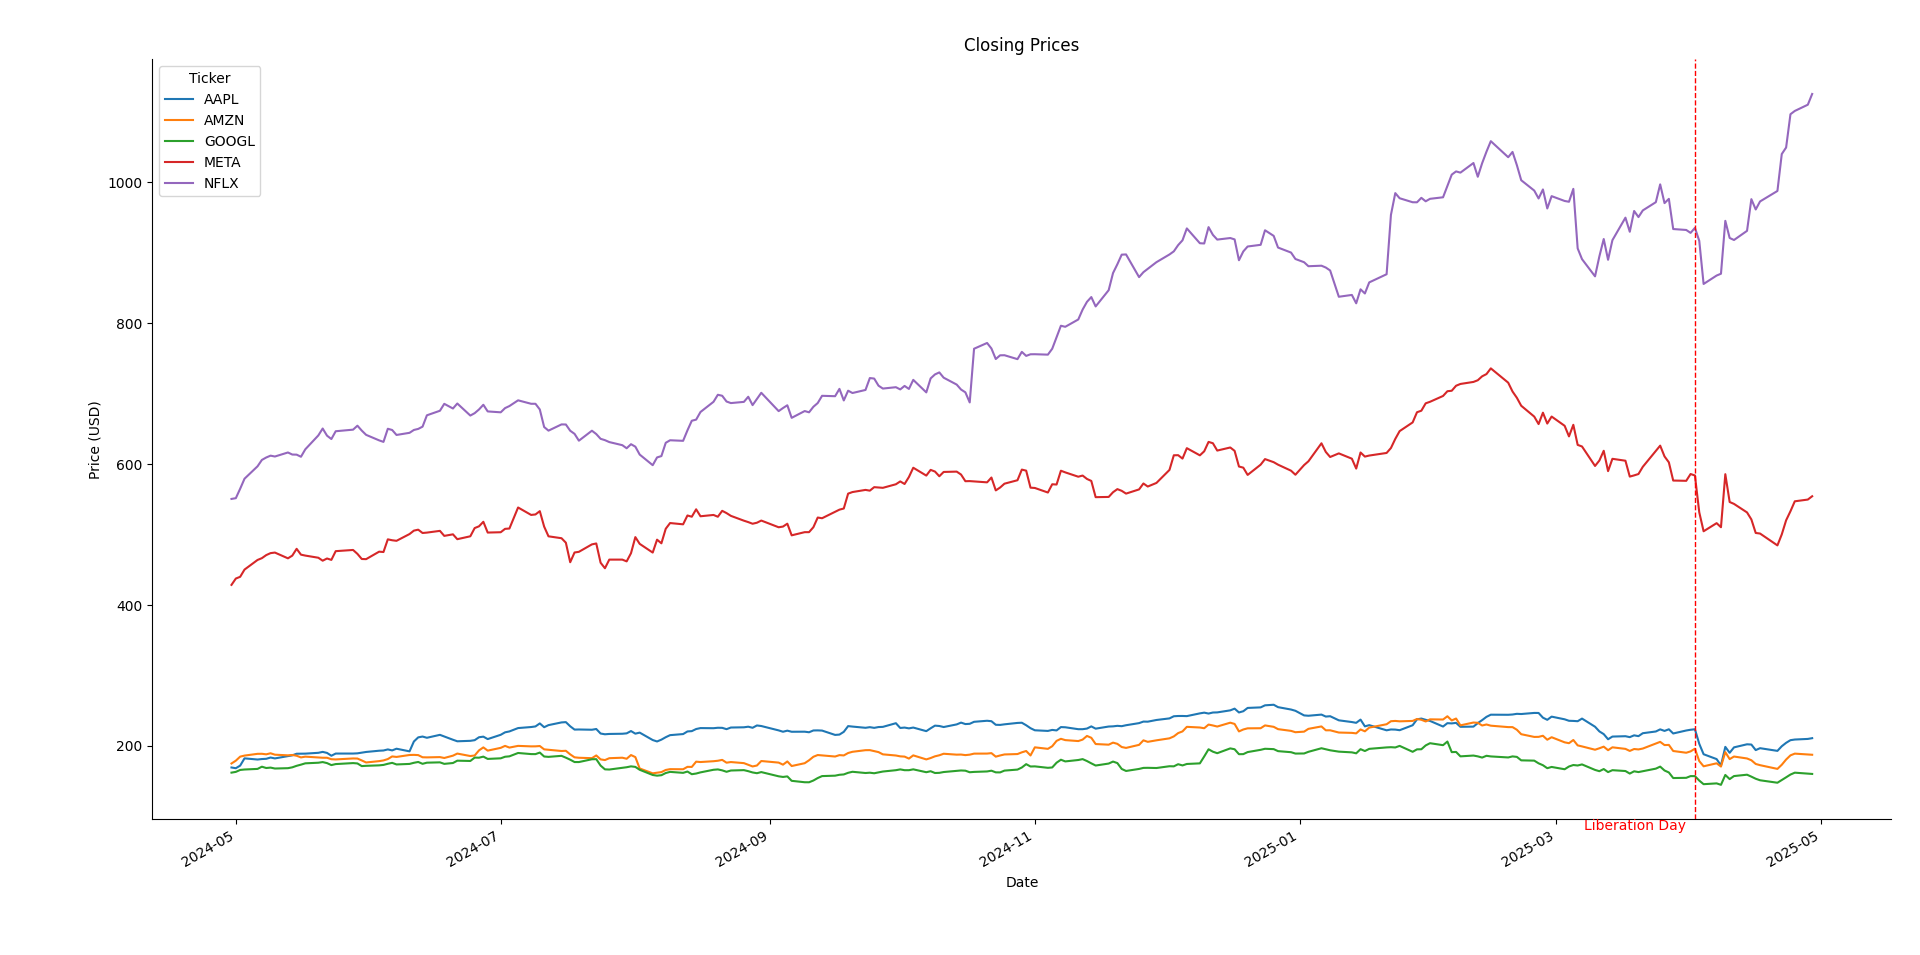
On the one hand, Netflix and Meta both fell sharply at the tariff announcement. However, Netflix recovered quickly, outperforming in the subsequent month, while Meta remained below its pre-event level. On the other hand, Apple, Amazon, Google experienced modest declines, then stabilized.
This complements portfolio optimization by showing how exogenous shocks can affect each stock.